

Key Takeaways
Correlation vs. Causation
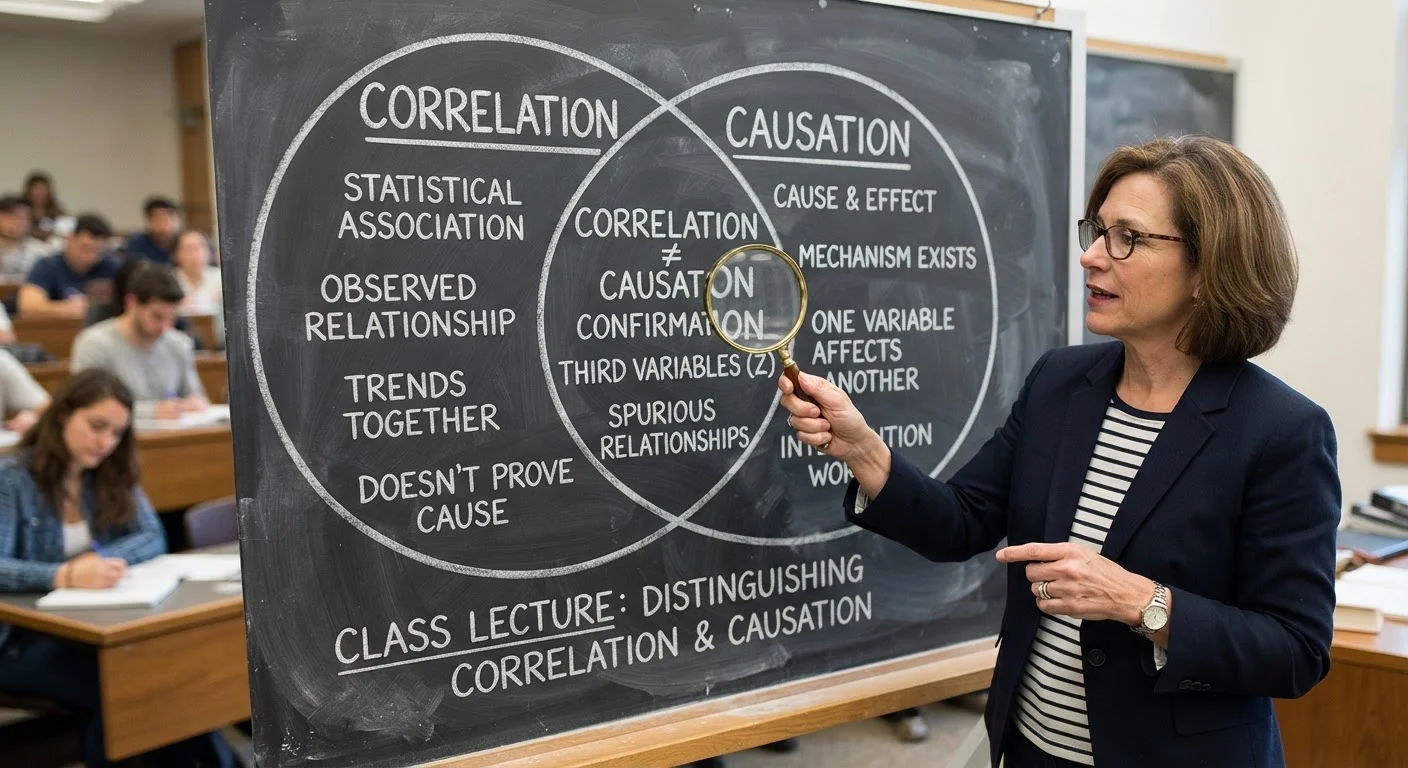
Correlation means two things tend to happen together or move in the same direction - when one goes up, the other tends to go up too. Causation means one thing actually causes the other to happen. Just because two things are correlated does not mean one is responsible for the other.
In statistics, correlation is measured by a correlation coefficient ranging from -1 to +1. Establishing causation typically requires controlled experiments, randomization, or rigorous observational study designs that can rule out confounding variables.
What These Terms Actually Mean
The phrase "correlation is not causation" gets repeated so often it has almost lost its meaning. But the idea behind it is genuinely important and worth unpacking carefully.
Correlation simply describes a relationship between two variables. When researchers say ice cream sales and sunburn rates are correlated, they mean both tend to rise and fall together. Causation means one variable directly produces a change in another. Sunlight causes sunburn. Sunlight also causes more people to buy ice cream. The ice cream itself is innocent.
The trouble is that the human brain is remarkably good at spotting patterns and remarkably eager to assign cause and effect. That instinct served our ancestors well in a world full of immediate physical threats. It serves us less well when interpreting data.
~50%
Studies that fail independent replication
Analyses of published psychology and social science research have found that roughly half of findings do not replicate, a crisis partly attributed to drawing causal conclusions from correlational data.
1965
Year Bradford Hill criteria were published
Epidemiologist Austin Bradford Hill outlined nine criteria for evaluating causal relationships in observational research - a framework still widely used in public health today.
3rd variable
Most common source of misleading correlations
Researchers and statisticians consistently identify confounding - the influence of an unmeasured third variable - as the leading reason two unrelated things appear to be connected in data.
The Role of the Confounding Variable
Most misleading correlations share a common culprit: a confounding variable, sometimes called a third variable or lurking variable. This is a factor that influences both of the things being measured, creating the appearance of a direct relationship where none exists.
A classic example: communities with more hospitals tend to have higher death rates. Does hospital density cause death? Of course not. Sicker populations both attract more hospitals and, inevitably, produce more deaths. The underlying health burden is the confounder.
In social science, income, education, and geography routinely confound research findings. A study might find that people who own dishwashers live longer - but dishwasher ownership is a proxy for wealth, and wealth drives access to healthcare, nutrition, and safer neighborhoods. The dishwasher is along for the ride.
Spurious Correlations Are Surprisingly Easy to Find
With large enough datasets, almost any two unrelated variables will show some statistical correlation by chance alone. Statistician Tyler Vigen's well-known "Spurious Correlations" project catalogued dozens of absurd but mathematically real correlations - from per-capita cheese consumption and deaths by bedsheet tangling to the number of civil engineering doctorates and mozzarella consumption. The lesson is that data needs interpretation, not just calculation.
Peer Review Is a Check, Not a Guarantee
Peer-reviewed publication means other experts have evaluated a study's methods - it does not mean the findings are definitively true or causal. Replication across multiple independent studies is a stronger signal of a reliable result than a single peer-reviewed paper, however prestigious the journal.
How Causation Is Actually Established
Proving causation requires ruling out alternative explanations. The most reliable tool scientists have is the randomized controlled trial (RCT). By randomly assigning people to a treatment or a control group, researchers neutralize confounding - both groups should, on average, have the same background characteristics. Any difference in outcomes can then be attributed to the treatment itself.
But RCTs aren't always possible or ethical. You can't randomly assign people to smoke for decades to test lung cancer risk. In those cases, researchers use observational studies, natural experiments, and statistical techniques designed to approximate what a controlled experiment would show. Epidemiologist Austin Bradford Hill proposed a set of criteria in 1965 - including consistency, strength of association, and biological plausibility - that researchers still use as a framework for weighing causal evidence.
The key takeaway is that causation is rarely declared from a single study. It accumulates through a body of converging evidence.
Why This Matters in Everyday Life
Confusing correlation with causation isn't just an academic error - it shapes real decisions. Policies have been built, products marketed, and treatments promoted on the basis of correlational findings that later fell apart under scrutiny.
Media coverage amplifies the problem. Headlines often drop the hedging that scientists carefully include. "Coffee linked to reduced Alzheimer's risk" becomes "Coffee prevents Alzheimer's" in a news cycle. Readers lose the distinction between "associated with" and "proven to cause."
Developing a habit of asking a few simple questions can help: Could a third factor explain this? Was this a controlled experiment or an observational study? Have other researchers replicated the finding? These questions don't require a statistics degree - they require only a willingness to slow down before accepting a claim at face value.
A study finds that children who have more books at home score higher on reading tests.
Nicolas Cage film releases are statistically correlated with drowning deaths in swimming pools over a period of years.
Early research observed that people who carried lighters were more likely to develop lung cancer.
A city notices that neighborhoods with more fast-food restaurants have higher rates of obesity.